

If you have started earning, you will start getting calls from companies asking to buy a credit card, take a personal loan or open a Demat account. Which sales pitch catches your attention depends on how the caller awakens your latent dreams.
For a new earner, these financial products create curiosity and the possibilities of how money is accessible in different forms and ways. While loans and credit cards infuse the habit of borrowing to buy a watch or a mobile phone, investing is often overlooked as it delays gratification.
However, if you study closely, share markets offer every possibility to generate wealth in minutes or days. The share market abounds with various shades of financial products and order types that can suit a long-term investor or a short-term trader.
Remember that the share market has the shares of various companies; their prices keep changing as buyers and sellers continuously bid prices at different levels. The charts track the price movement of shares, and investors watch these price charts on Demat account and Trading Account. Now, a fascinating point – these price charts can be analyzed through statistical tools to make calculated predictions on future price movements. Learning this skill of chart analysis can be a great aid in harnessing the benefits that the stock market has to offer.
What are charts and different types of charts?
If you have a Demat and Trading account, select a share and open its chart. Chances are you will see a candlestick chart, the most popular form of the price chart. It has red and green coloured bars, called candles, with lines at the top and bottom, called wicks. Let’s quickly get introduced to this peculiar-looking thing-
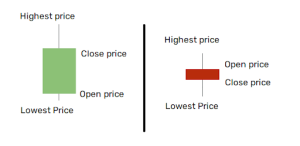
- Each candle represents the price movement of a share in the given time frame. So, if you set the candlestick duration to 15 minutes, each candle shows the price movement in the 15 minutes
- A green candle means the price grew higher as the 15 minutes passed. A red candle means the price fell in the next 15-minute session
- The thin line extending at the two ends of the candle body represents the highest and lowest value of a share in the given 15-minute duration.
There are other forms of charts as well which are good to know about:
- Line Chart
- Bar Chart
- Mountain Chart
- Baseline
- Heikin Ashi
- Renko
There are other chart variants as well since the statisticians and analysts devise new ways to represent price movements. Heikin Ashi & Renko is a relatively popular form of chart coming from the early Japanese trading community. The candlestick chart also finds its origin in Japan.
These charts create a visual picture of the ongoing price tussle between buyers and sellers. With the subsequent green and red bars moving up or down, trending upside or downside creates a context to predict the possible price movements. Statisticians, mathematicians, and researchers over generations have developed complex calculations that can assess the prices on the chart and give an indicative future trend. Thankfully, you don’t need to get into these calculations. Charts present them as ‘Indicators’. You can select an Indicator from the dropdown; immediately, a few lines or other visuals will populate your chart that’ll help you gauge where the price is headed, and whether you should buy, sell or wait.
Popular indicators
Indicators are like your prudent friends who can help you escape indecisiveness in the stock market; all you need to do is get them into the scene. The indicators are visually distinct, and any buy or sell signal can be spotted through little additional work. Several indicators are part of Chart tools today, and a few of them have attained cult followership in the trading community across the globe. Some of them are-
- Moving Average Convergence Divergence, popularly known as MACD
- Relative Strength Index, popularly known as RSI
- Moving Averages
- Pivot Points
- VWAP
- Supertrend
- Bollinger Bands
Any share market enthusiast should get familiar with these indicators. They help form a view of the price movement and add sense to otherwise abstract charts.
Moving Averages, for example, are plotted to check whether the current price is above or below the long-term or short-term average price. If the current price is below the long-term and the short-term average price, it indicates a weakness in share price. Once the short-term average price line cuts the long-term average price from below, you can interpret that price is gaining strength and can be a suitable time to buy.
Scanners and Filters
So, armed with a buffet of indicators, should you start analyzing every stock to identify trade opportunities? Well, it’s a good practice to research individual stocks on multiple indicators and make calculated moves. Indicators can help make an informed decision, but the success rate will always be below 100%. No Indicator or study can give 100% success. The endeavour is to reduce failure rates by avoiding arbitrary decisions and instead making calculated moves.
Here, it will be great to introduce a notable feature called scanners and filters provided by some stockbrokers on their Demat & Trading Account. For example, Bajaj Financial Securities Limited provides this feature on their trading application. Using this, you can filter out stocks in the buy or sell zone according to popular Indicators. So, instead of applying an Indicator to each stock, you can filter all stocks at key levels on a price chart basis the popular Indicators using Scanners and Filters.
Conclusion
Share Market is an arena full of opportunities to grow wealth. Investors who spend time understanding the market dynamics and the tools available to study the market harness the most benefits. Price charts and Indicators are crucial to concoct a view on price movements & capitalize on the ever-fluctuating prices.